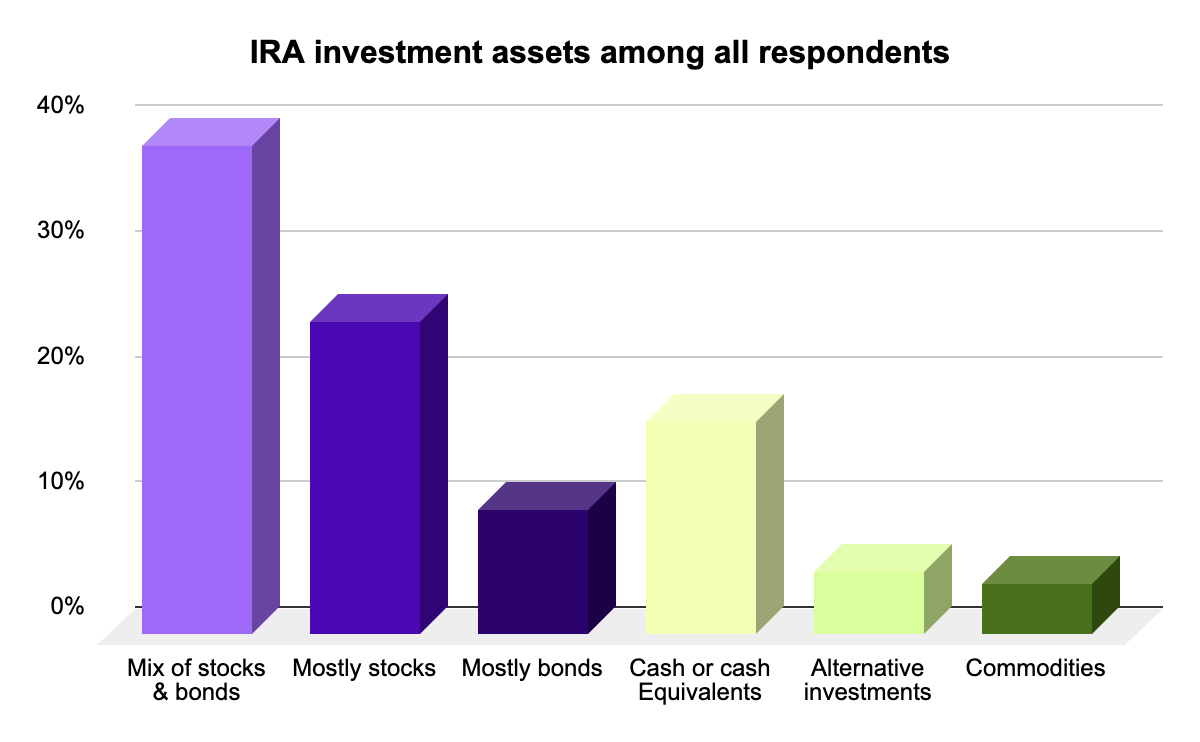
We asked 2,490 Americans to tell us about the main investment focus in their IRA (Individual Retirement Account) portfolio. More than half (53%) of the people we surveyed said they don’t have an IRA. For the 47% who do have an IRA, here’s the main investment focus of their retirement portfolios.
Key Takeaways of Moneywise's 2024 IRA Investment Survey
- More than half (53%) of the people we surveyed said they don’t have an IRA.
- Men prefer investing in stocks more than women, but both prioritize cash or cash equivalents for stability and liquidity.
- Younger investors favor safer options like cash, while older groups lean on balanced portfolios of stocks and bonds.
- Higher-income and more educated respondents are more confident in taking risks with stocks and diversified strategies, while those with lower incomes or less education stick to safer, more liquid investments.
- While mixed portfolios are the top choice nationwide, the Midwest invests more cautiously, the Northeast and West stay balanced, and the South takes the most risks.
How Americans invest their IRA funds
Of the respondents surveyed, mixed portfolios (stocks and bonds) dominated Americans’ portfolios at 39% — with people investing in mostly stocks trailing at 25%. This suggests a conservative approach by these investors in order to balance growth and risk. The preference for mixed portfolios shows how much people value diversification to keep their retirement savings protected. Commodities and alternative investments (4% and 5% each) are the least common choices, which reasserts the preference for more traditional investments.
How people invest in IRA funds, segmented by gender identity
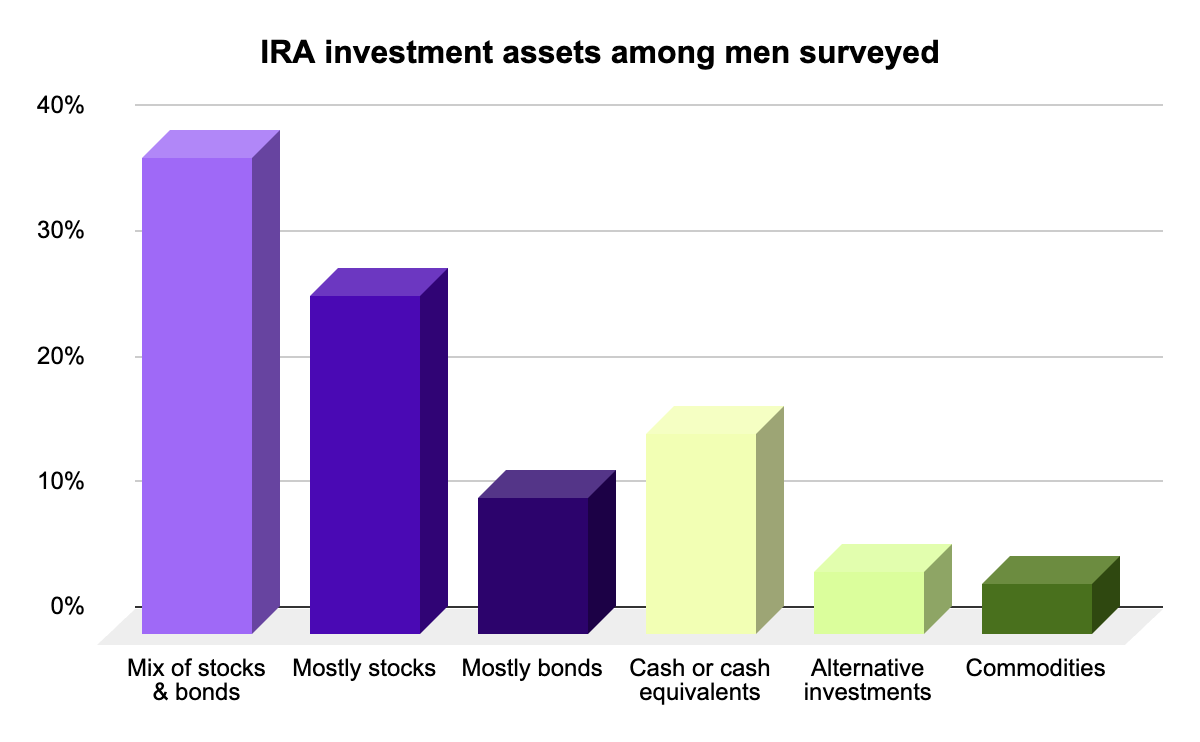
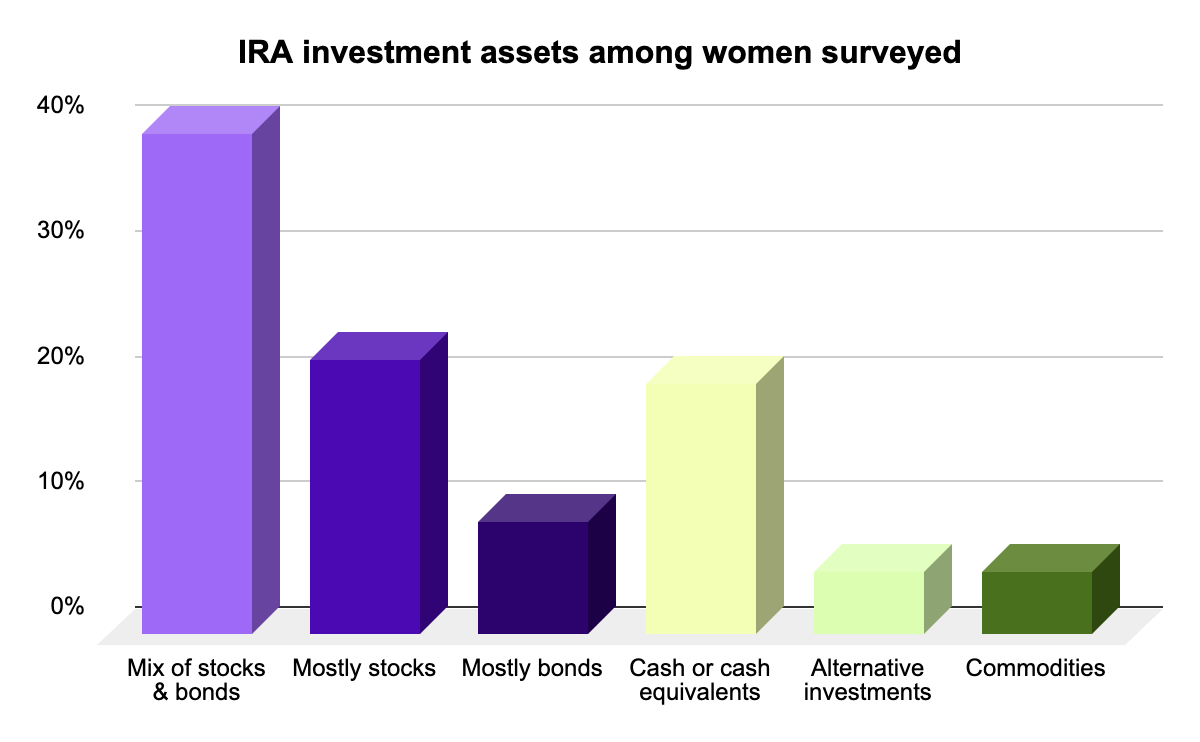
Investment strategies differ between men and women, but some patterns remain consistent. Both men and women prioritize mixed portfolios, with 38% of men and 40% of women listing them as their primary IRA investment. Men and women are also similarly lukewarm about niche strategies like commodities and alternative investments.
IRA investment assets among men surveyed
Men are more likely than women to invest in an IRA, and their investment choices reflect a greater appetite for risk. Stocks are the top asset choice for 27% of men, compared to only 22% of women. This suggests that men may be more willing to take risks in pursuit of higher returns or that they have more disposable income to invest aggressively.
IRA investment assets among women surveyed
Of the women we surveyed, 58% reported not having an IRA, compared to 47% of men. This suggests a gender gap in retirement account ownership. Women tend to take a more balanced approach to asset allocation, with 40% choosing a mixed portfolio. Women also hold more cash or cash equivalents than men (20% vs. 16%), which suggests a more conservative or liquid investing strategy.
How people invest in IRA funds, segmented by age
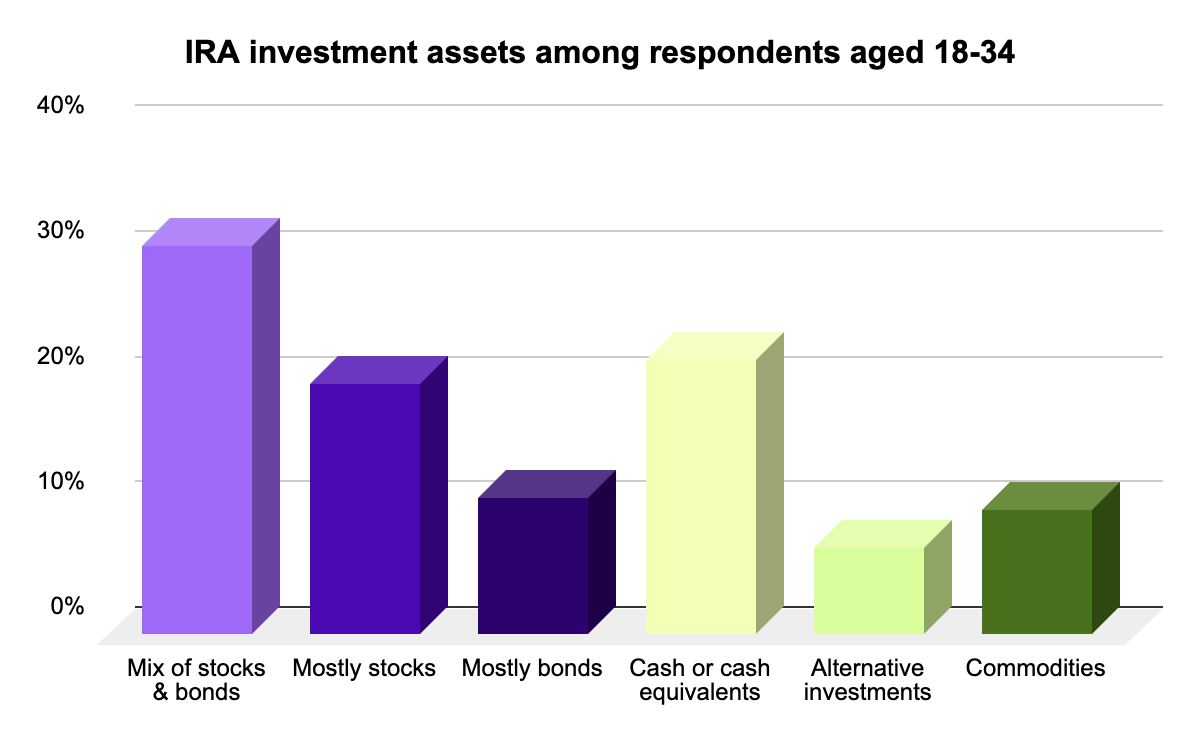
Younger investors tend to favor cash, while also showing more interest in commodities. Mid-career investors grow more confident, increasing stock holdings while still favoring mixed portfolios. By 55 and up, stability takes priority, with a stronger focus on a stock-and-bond mix and less reliance on cash.
IRA investment assets among respondents aged 18-34
Younger investors, aged 18-34, seem to be holding tight to cash or cash-like investments (22%), more than any other age group, perhaps because they are easier-to-access funds which can be used for big-ticket items like a car or a house. Interestingly, this group also shows a higher interest in commodities (10%) compared to older people.
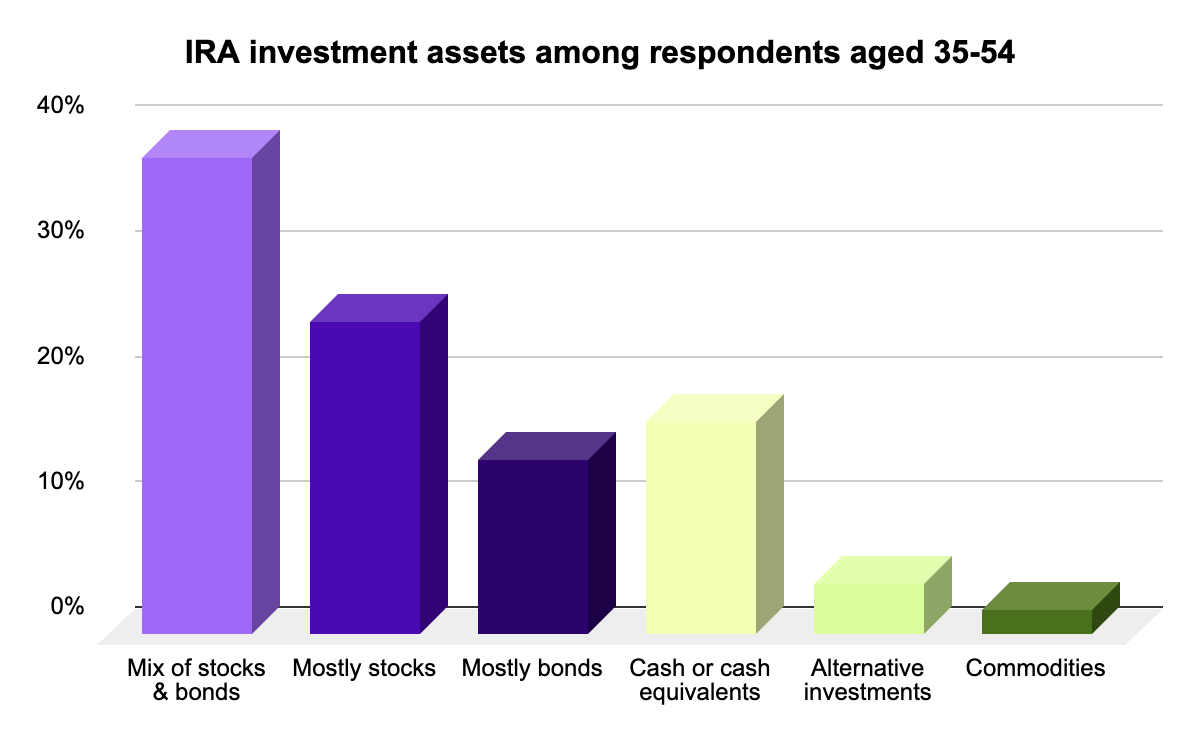
IRA investment assets among respondents aged 35-54
As people hit their mid-career years (ages 35-54), confidence grows. Mixed portfolios (38%) still dominate, but stock investments (25%) become more common, reflecting a better understanding of market cycles.
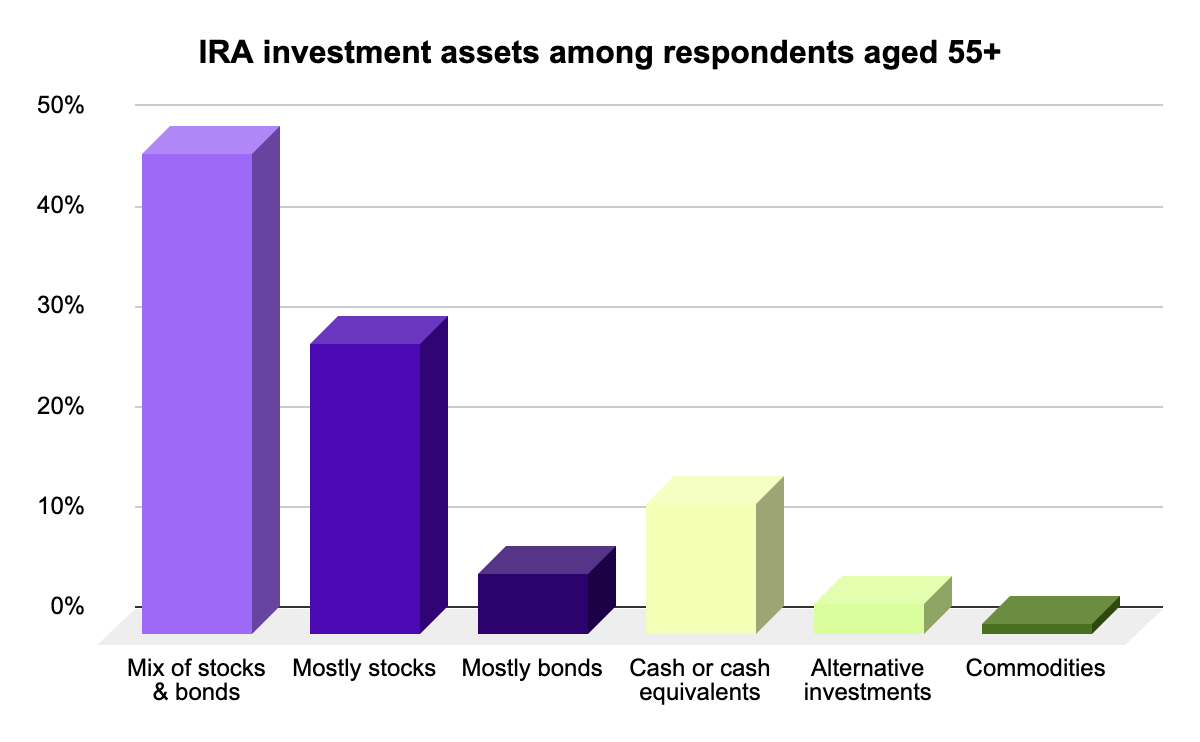
IRA investment assets among respondents aged 55+
By the age of 55 and up, the overall retirement portfolio focus has again shifted to a mix of stocks and bonds (48%), a classic, stability-focused strategy. This group has less interest in cash (13%) — showing, perhaps, that they know they don’t have as much time to bounce back from financial missteps. Curiously, 58% of respondents aged 55+ have no IRA, which suggests some older adults may rely on other retirement resources.
How people invest in IRA funds, segmented by income level
Income influences investment choices. A staggering 65% of those earning under $40k have no IRA, compared to just 30% for those earning $80k+. Those earning under $40K prioritize cash for flexibility but still explore alternative investments for potential gains. The $40K–$79.9K group takes a balanced approach, mixing growth and stability. Higher earners ($80K+) focus on stocks and diversified portfolios, showing confidence in long-term growth.
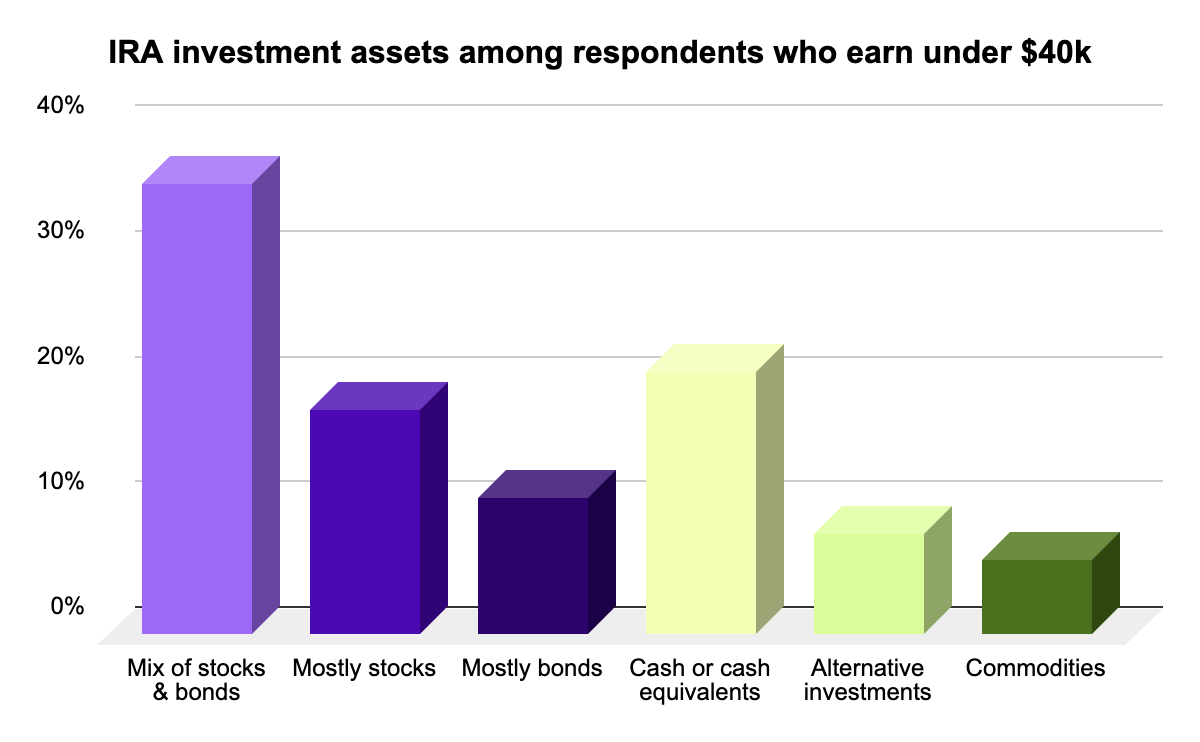
IRA investment assets among respondents who earn under $40k
People earning less than $40K tend to focus more on cash (21%) than stocks (17%) or bonds (11%), which makes sense — they’re likely prioritizing safer, more accessible options since financial flexibility is tighter. Interestingly, 8% of this group is dipping into alternative investments.
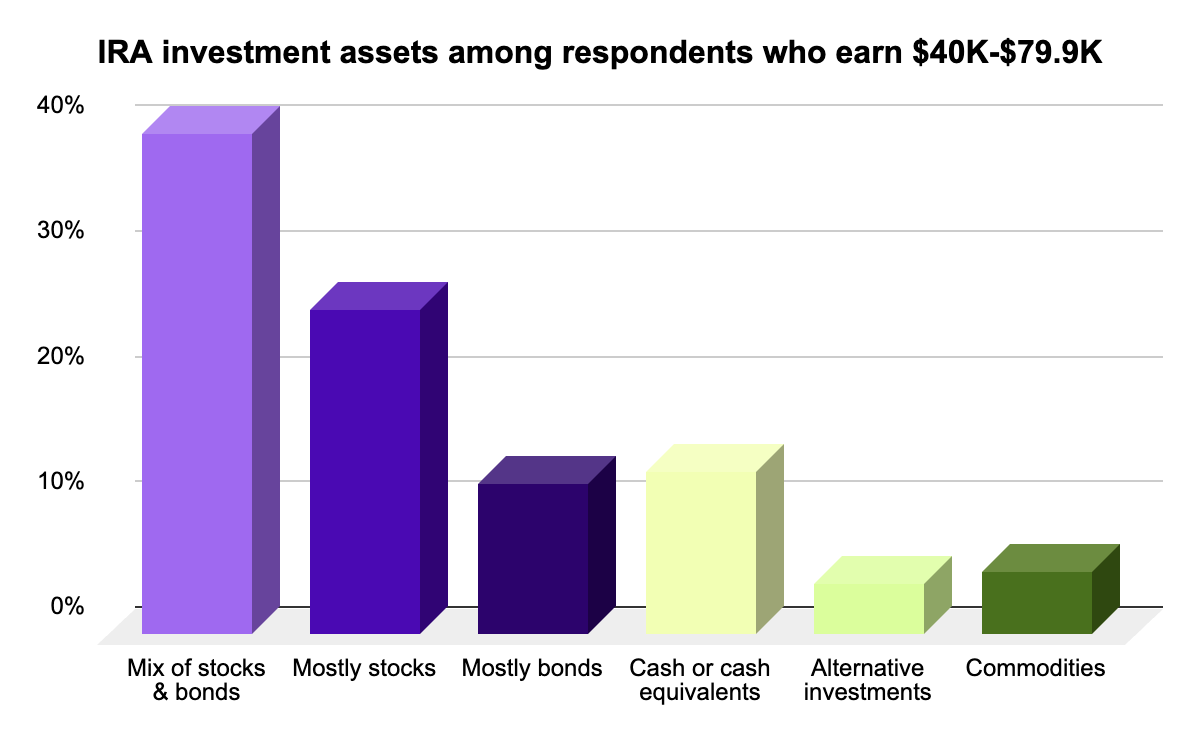
IRA investment assets among respondents who earn under $40K-$79.9K
Those in the $40K-$79.9K range play it a little safer, balancing growth and stability with mixed portfolios (40%) and stocks (26%).
IRA investment assets among respondents who earn under $80k
For the $80K+ crowd, it’s clear they’ve got confidence and resources. Stocks (28%) and mixed portfolios (41%) dominate, showing they can afford to diversify and aim for growth while covering their bases.

How people invest in IRA funds, segmented by level of education
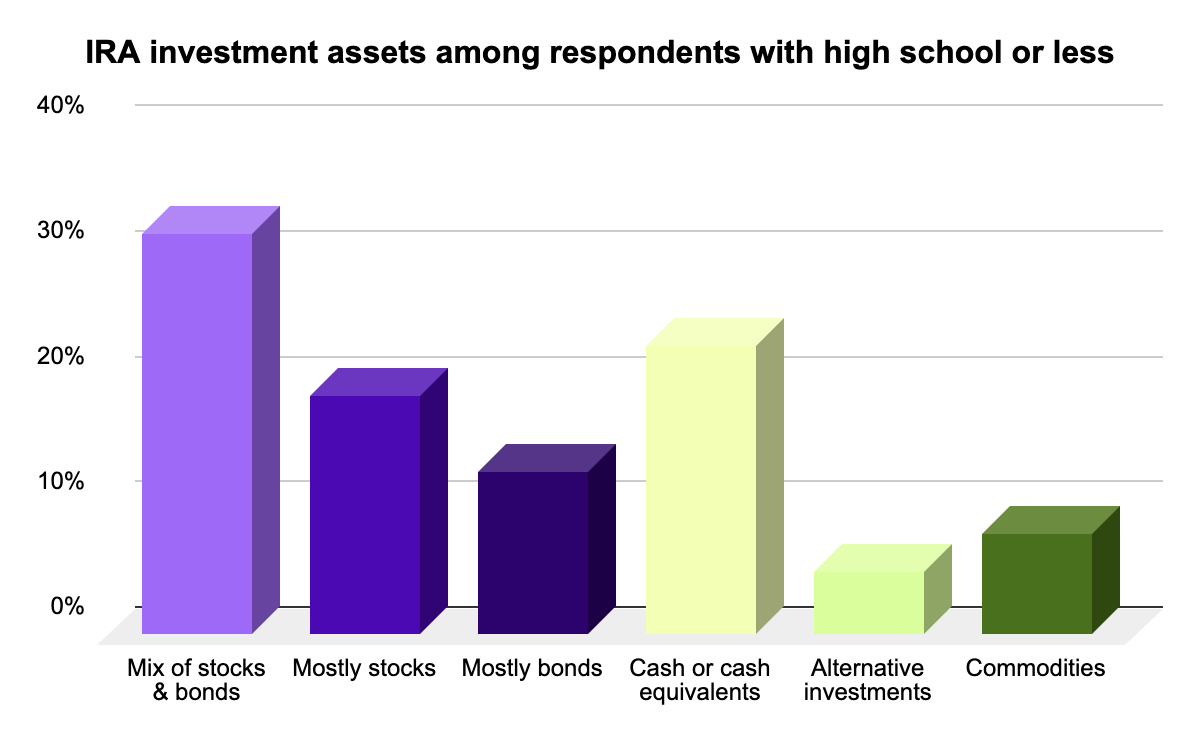
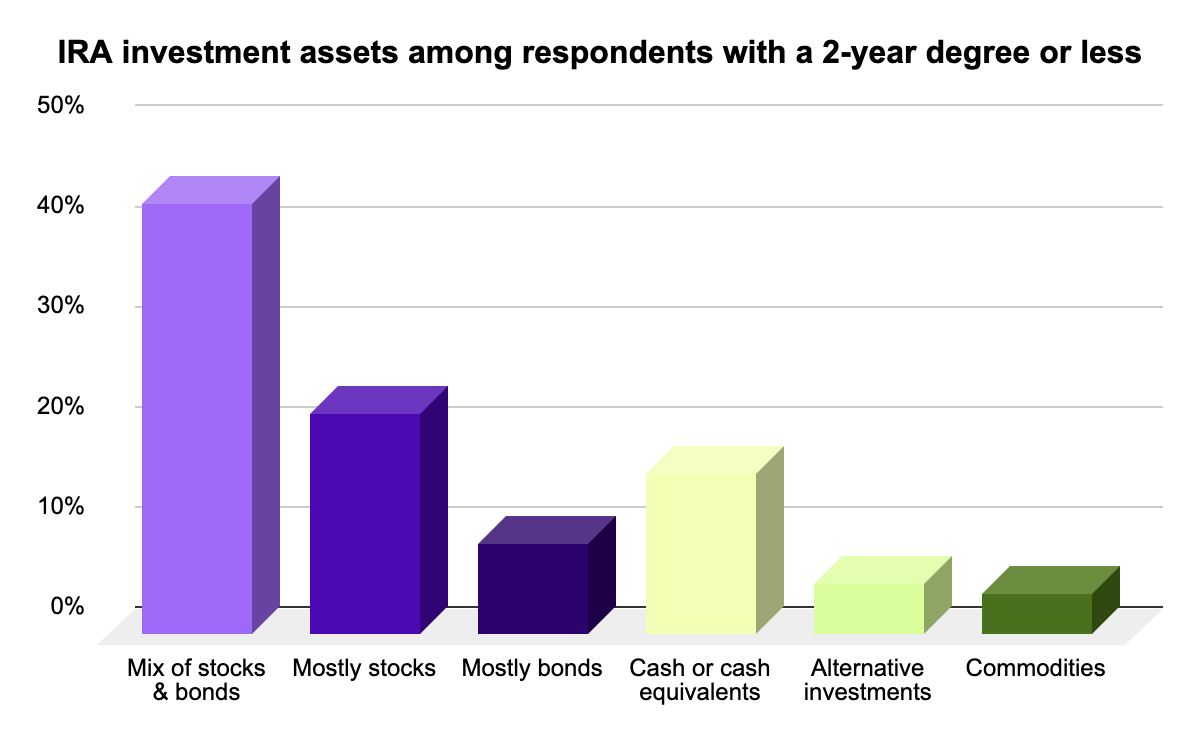
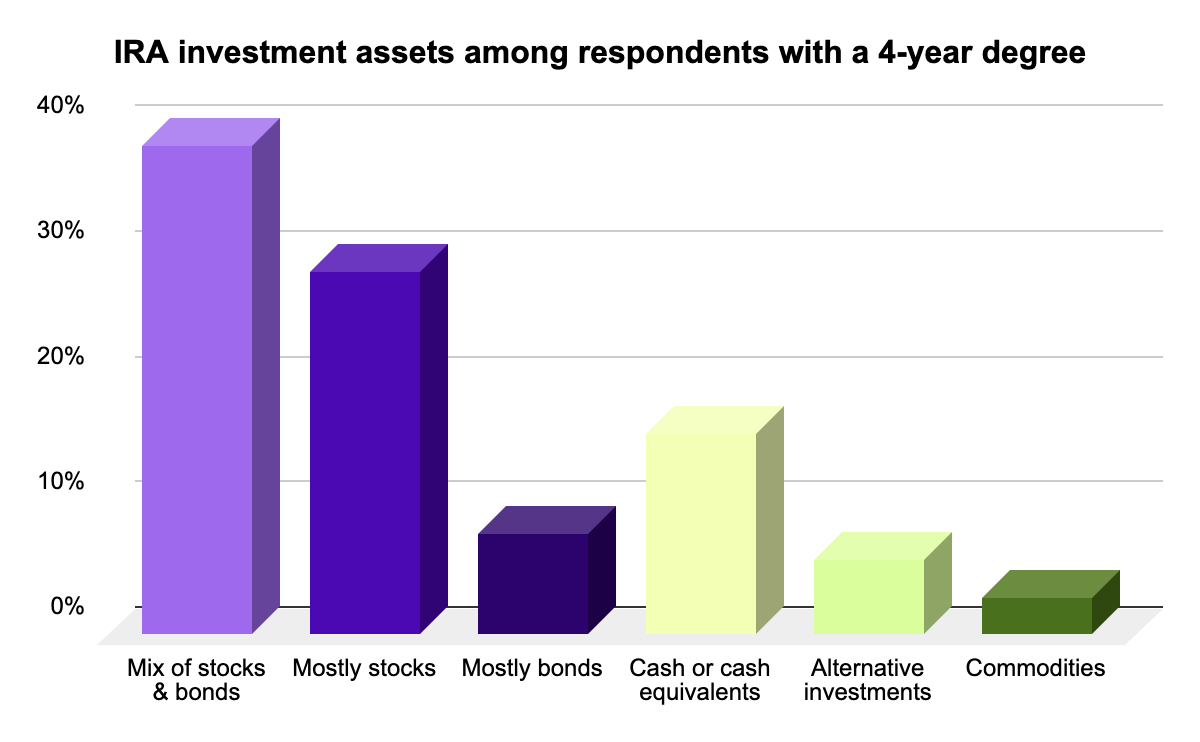
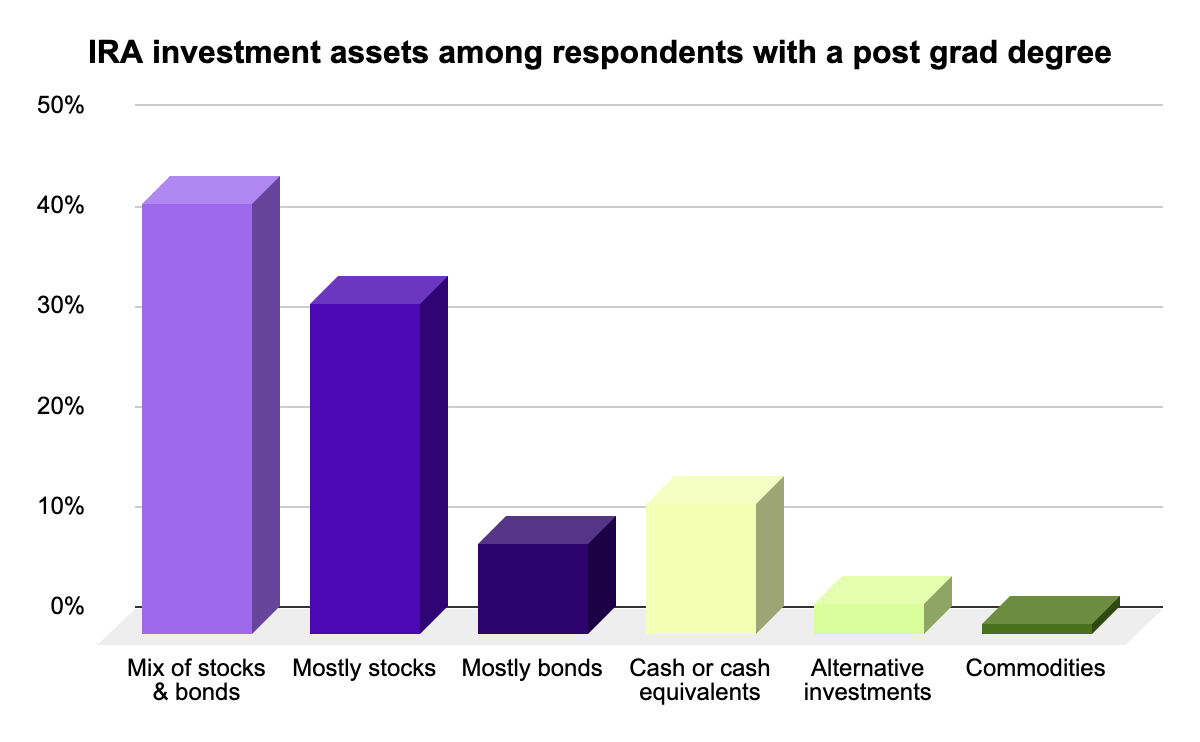
Investment choices shift with education levels, and higher levels of education correlate to higher IRA participation. A full 67% of those with a high school diploma or less have no IRA, compared to only 28% of post-graduate degree holders.
Those with a high school education or less tend to play it safe, sticking mostly to balanced portfolios and cash. Confidence grows among those with some college or a 2-year degree, though stability remains a priority. A 4-year degree marks a turning point, with more investors leaning into stocks and taking bigger risks. Those with postgraduate degrees show the highest confidence, favoring stocks and diversified strategies for long-term growth.
IRA investment assets among respondents with a high school education or less
Investors with a high school education or less primarily favor a mix of stocks and bonds (32%) but are less likely to explore other IRA options. Only 19% invest mostly in stocks, which may reflect a cautious approach, lower confidence, or having less capital to invest.
IRA investment assets among respondents with 2-year college degree or less
Those with some college or a 2-year degree place less emphasis on cash (16%) and more emphasis on stocks (22%) than respondents with no college. While slightly more open to investment options, they still prioritize stability over higher-risk strategies, with 43% favoring mixed portfolios.
IRA investment assets among respondents with a 4-year college degree
Confidence grows with a 4-year degree, leading to a noticeable jump in stock investments. The percentage of investors focusing mostly on stocks rises to 29%, while 39% maintain a mix of stocks and bonds, signaling a shift toward more aggressive growth strategies.
IRA investment assets among respondents with a post grad degree
Investors with postgraduate degrees show the highest confidence in stocks and diversified strategies. Stock-focused investments climb to 33%, while 43% hold mixed portfolios. With more knowledge and resources, this group is the most likely to take on higher-risk investments for greater long-term gains.
How people invest in IRA funds, segmented by income geographical location
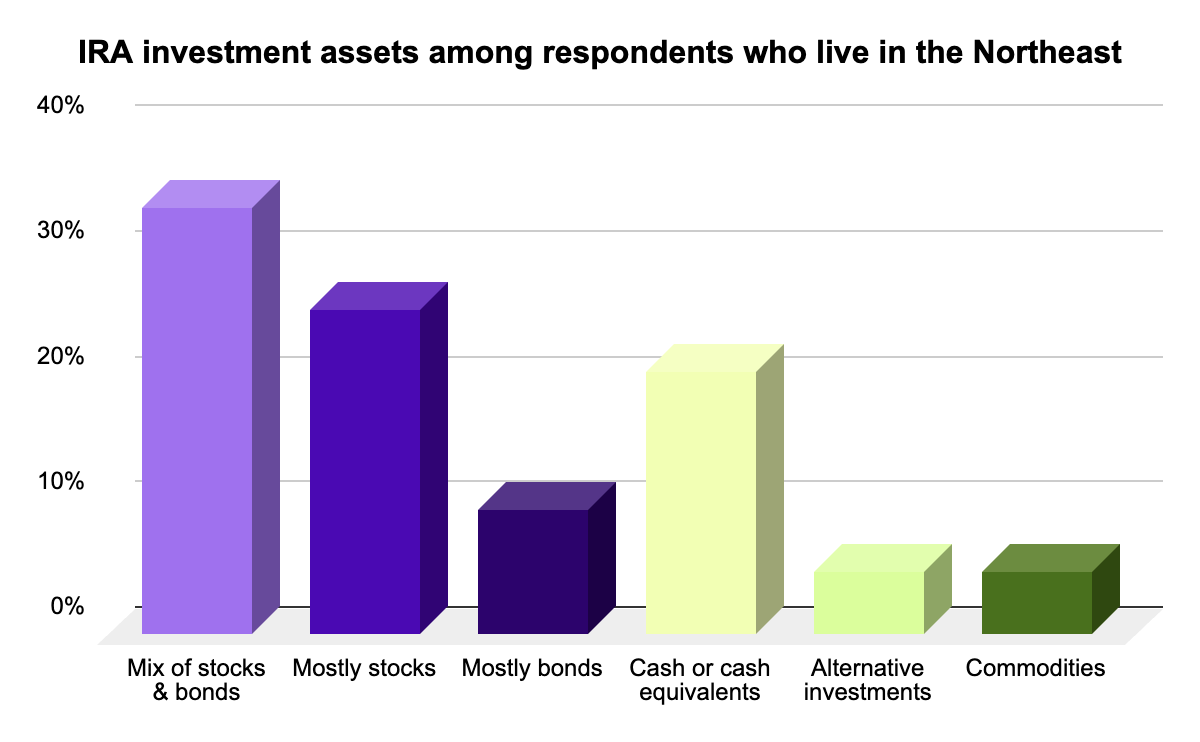
For this YouGov survey, we used U.S. Census divisions1 to define the four regions: Northeast, Midwest, South, and West.
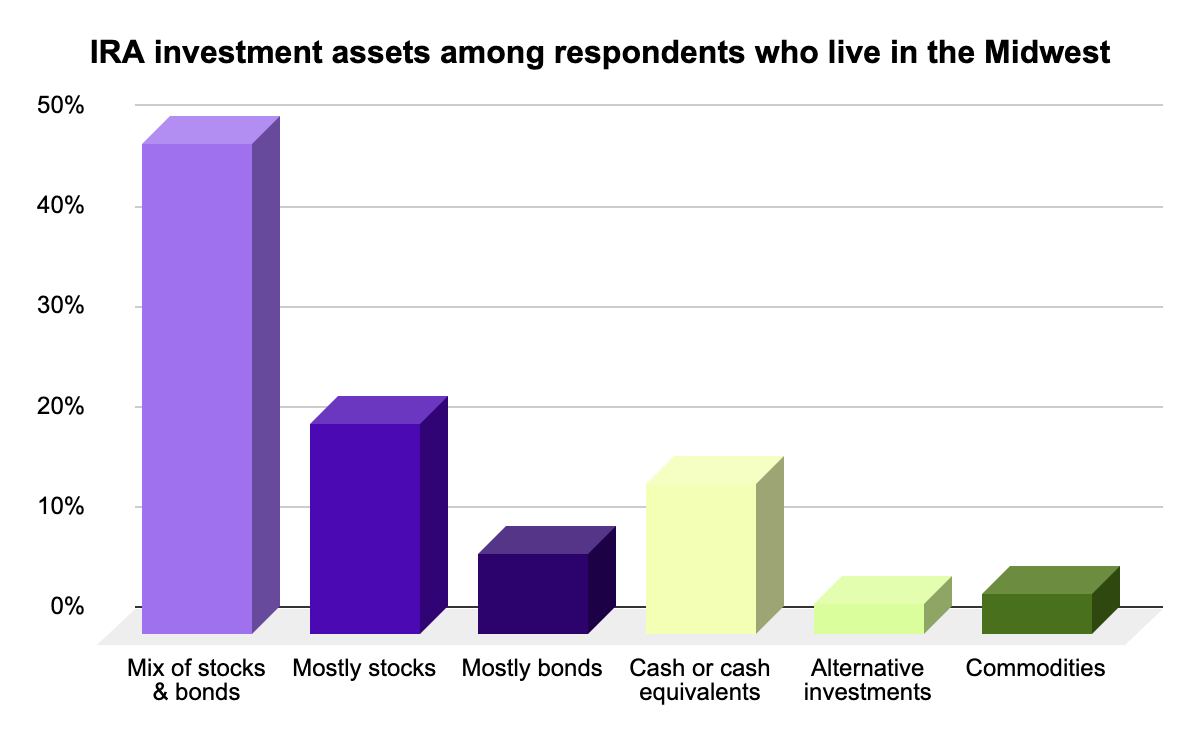
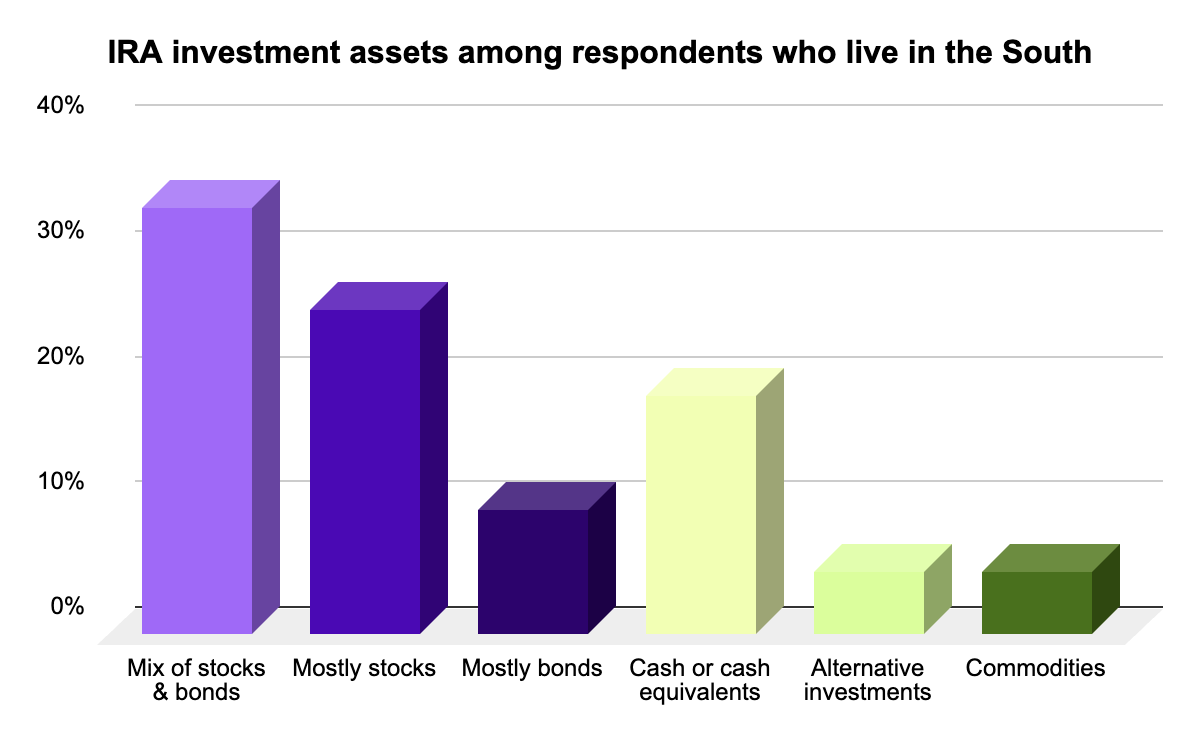
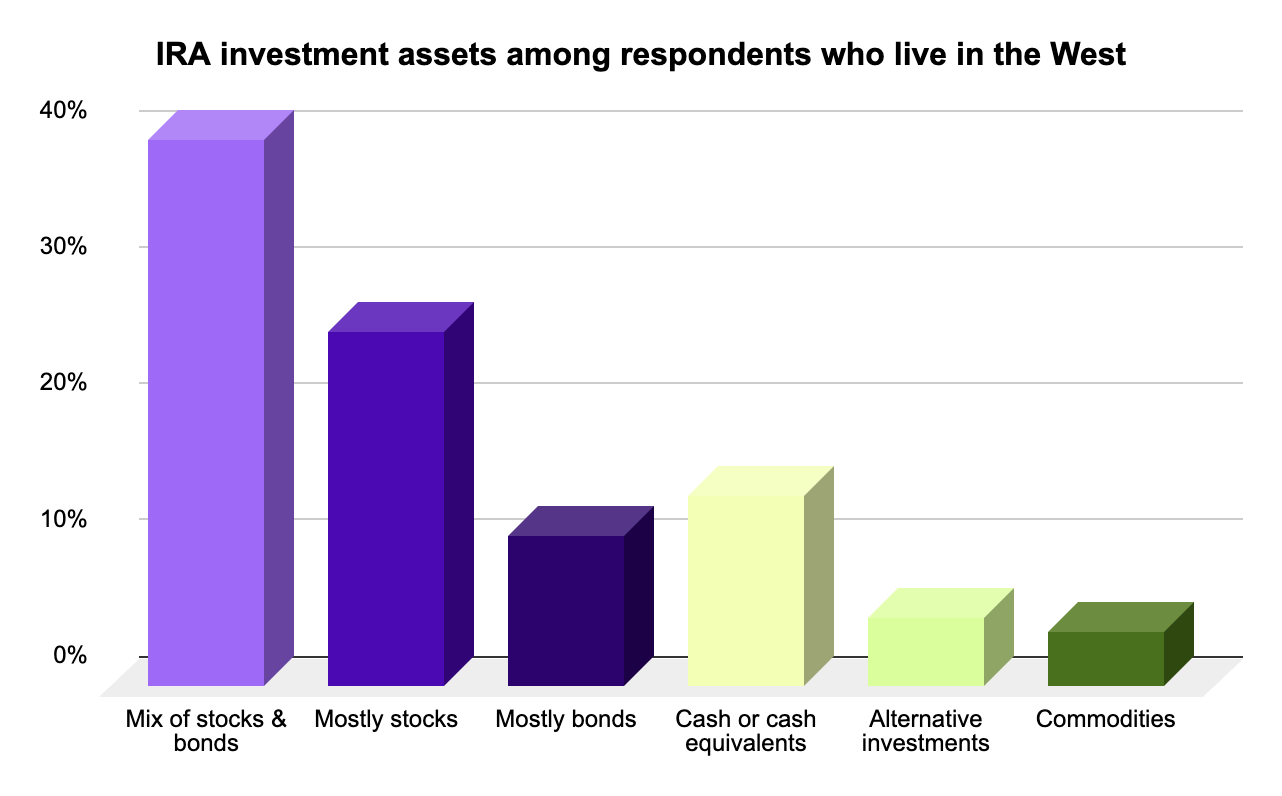
Investors across all regions favor mixed portfolios, but their risk tolerance varies. The Midwest leans the most conservative, with the highest share in balanced investments and the lowest in stocks. The Northeast and South follow similar patterns, maintaining a steady mix of stocks and bonds.
IRA investment assets among respondents who live in the Northeast
Investors in the Northeast take a balanced approach, with 34% favoring mixed portfolios. Stock-focused investments are also common at 26%, aligning closely with trends seen in the West.
IRA investment assets among respondents who live in the Midwest
Midwestern investors appear the most cautious, with 49% choosing mixed portfolios — the highest of any region — while only 21% invest primarily in stocks. This suggests a preference for stability over risk.
IRA investment assets among respondents who live in the South
At 56%, the South has the highest proportion of respondents without an IRA among the four regions. While 34% of Southerners hold a stock-and-bond mix — slightly lower than the overall 39% mixed rate nationwide — it still ranks as the most common strategy in the region, underscoring the enduring popularity of a balanced approach.
IRA investment assets among respondents who live in the West
The West leads all regions in bond-focused portfolios at 11%. This is a relatively small number but stands out given that other regions hover around 8–10%. Only 14% of Western respondents invest primarily in cash or cash equivalents — the smallest proportion among the four regions.
Methodology — how we gathered this data
Original data presented by Moneywise.com was gathered through a survey conducted using an online interview administered to members of the YouGov Plc panel of individuals who have agreed to take part in surveys.
Emails were sent to panelists selected at random from the base sample. The e-mail invited them to take part in a survey and provided a generic survey link. Once a panel member clicked on the link they were sent to the survey that they were most required for, according to the sample definition and quotas. (The sample definition could be "US adult population" or a subset such as "US adult females").
Invitations to surveys don’t expire and respondents could be sent to any available survey. The responding sample is weighted to the profile of the sample definition to provide a representative reporting sample. The profile is normally derived from census data or, if not available from the census, from industry accepted data.
All original data presented in this article is from YouGov Plc. The total sample size was 2,490 adults. Fieldwork was undertaken between 21st November - 25th November 2024. The survey was carried out online.

The Moneywise Editorial Team is a group of passionate financial experts, seasoned journalists, and content creators who are deeply committed to providing unbiased, relevant, and accurate financial information. With years of combined industry experience, our team is dedicated to maintaining the highest journalistic standards and delivering informative and engaging content. From personal finance and investing to retirement planning and business finance, we cover a broad range of topics to suit the financial needs of our diverse readership. You can trust the Moneywise Editorial Team to empower you with the knowledge and tools necessary to make wise financial decisions.
Disclaimer
The content provided on Moneywise is information to help users become financially literate. It is neither tax nor legal advice, is not intended to be relied upon as a forecast, research or investment advice, and is not a recommendation, offer or solicitation to buy or sell any securities or to adopt any investment strategy. Tax, investment and all other decisions should be made, as appropriate, only with guidance from a qualified professional. We make no representation or warranty of any kind, either express or implied, with respect to the data provided, the timeliness thereof, the results to be obtained by the use thereof or any other matter. Advertisers are not responsible for the content of this site, including any editorials or reviews that may appear on this site. For complete and current information on any advertiser product, please visit their website.
†Terms and Conditions apply.


